轻量级日志收集方案:LAG
见字如面,与大家分享实践中的经验与思考。
之前一直使用的 Elastic Stack 家族的 EFK 方案(ElasticSearch + Fluent Bit + Kibana),在配置集群的情况下,需要占用好几个G的内存。最近上线了个人独立开发的 app 后,配置不是特别好,就研究一下轻量级的日志收集方案:Loki + Alloy + Grafana(简称 LAG),部署完成后大概花费了 300 MB的内存,推荐大家尝试。
LAG 介绍
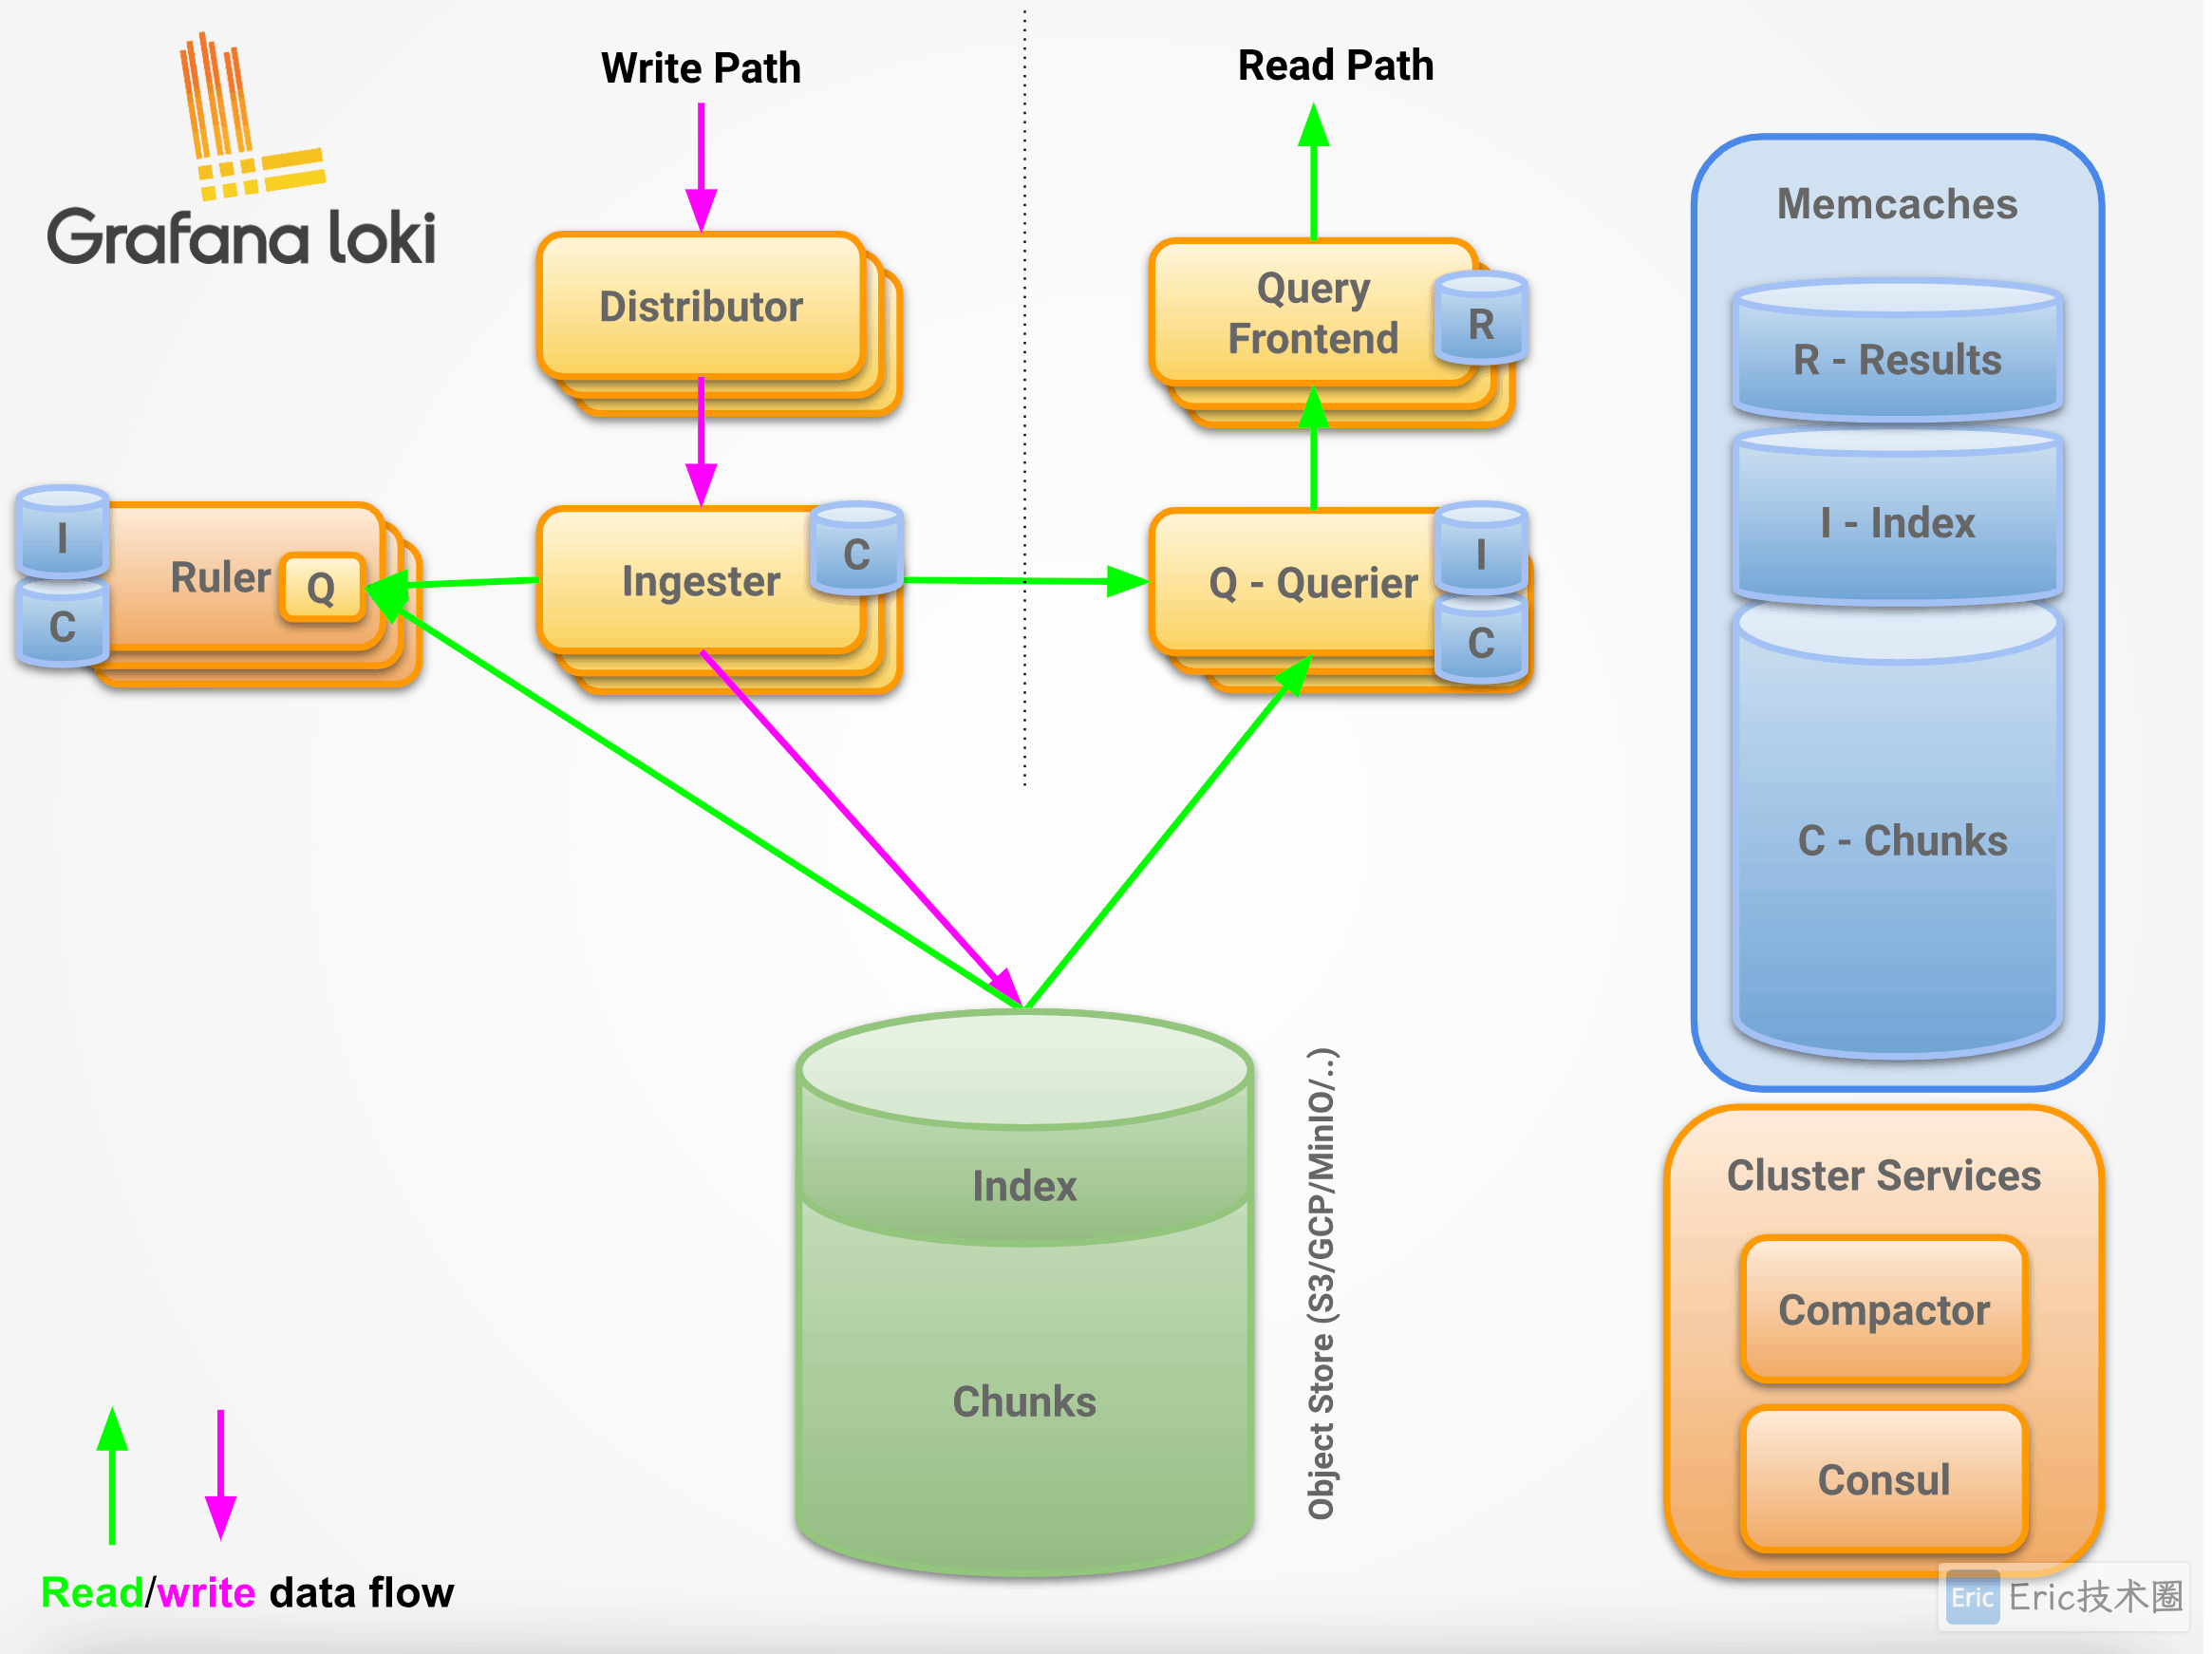
Grafana Loki 采用基于微服务的架构,设计为可水平扩展的分布式系统。该系统具有多个可以单独运行并并行运行的组件。Grafana Loki 的设计将所有组件的代码编译成一个单一的二进制文件或 Docker 镜像。 -target 命令行标志控制该二进制文件将作为哪个组件运行。
Loki 架构图
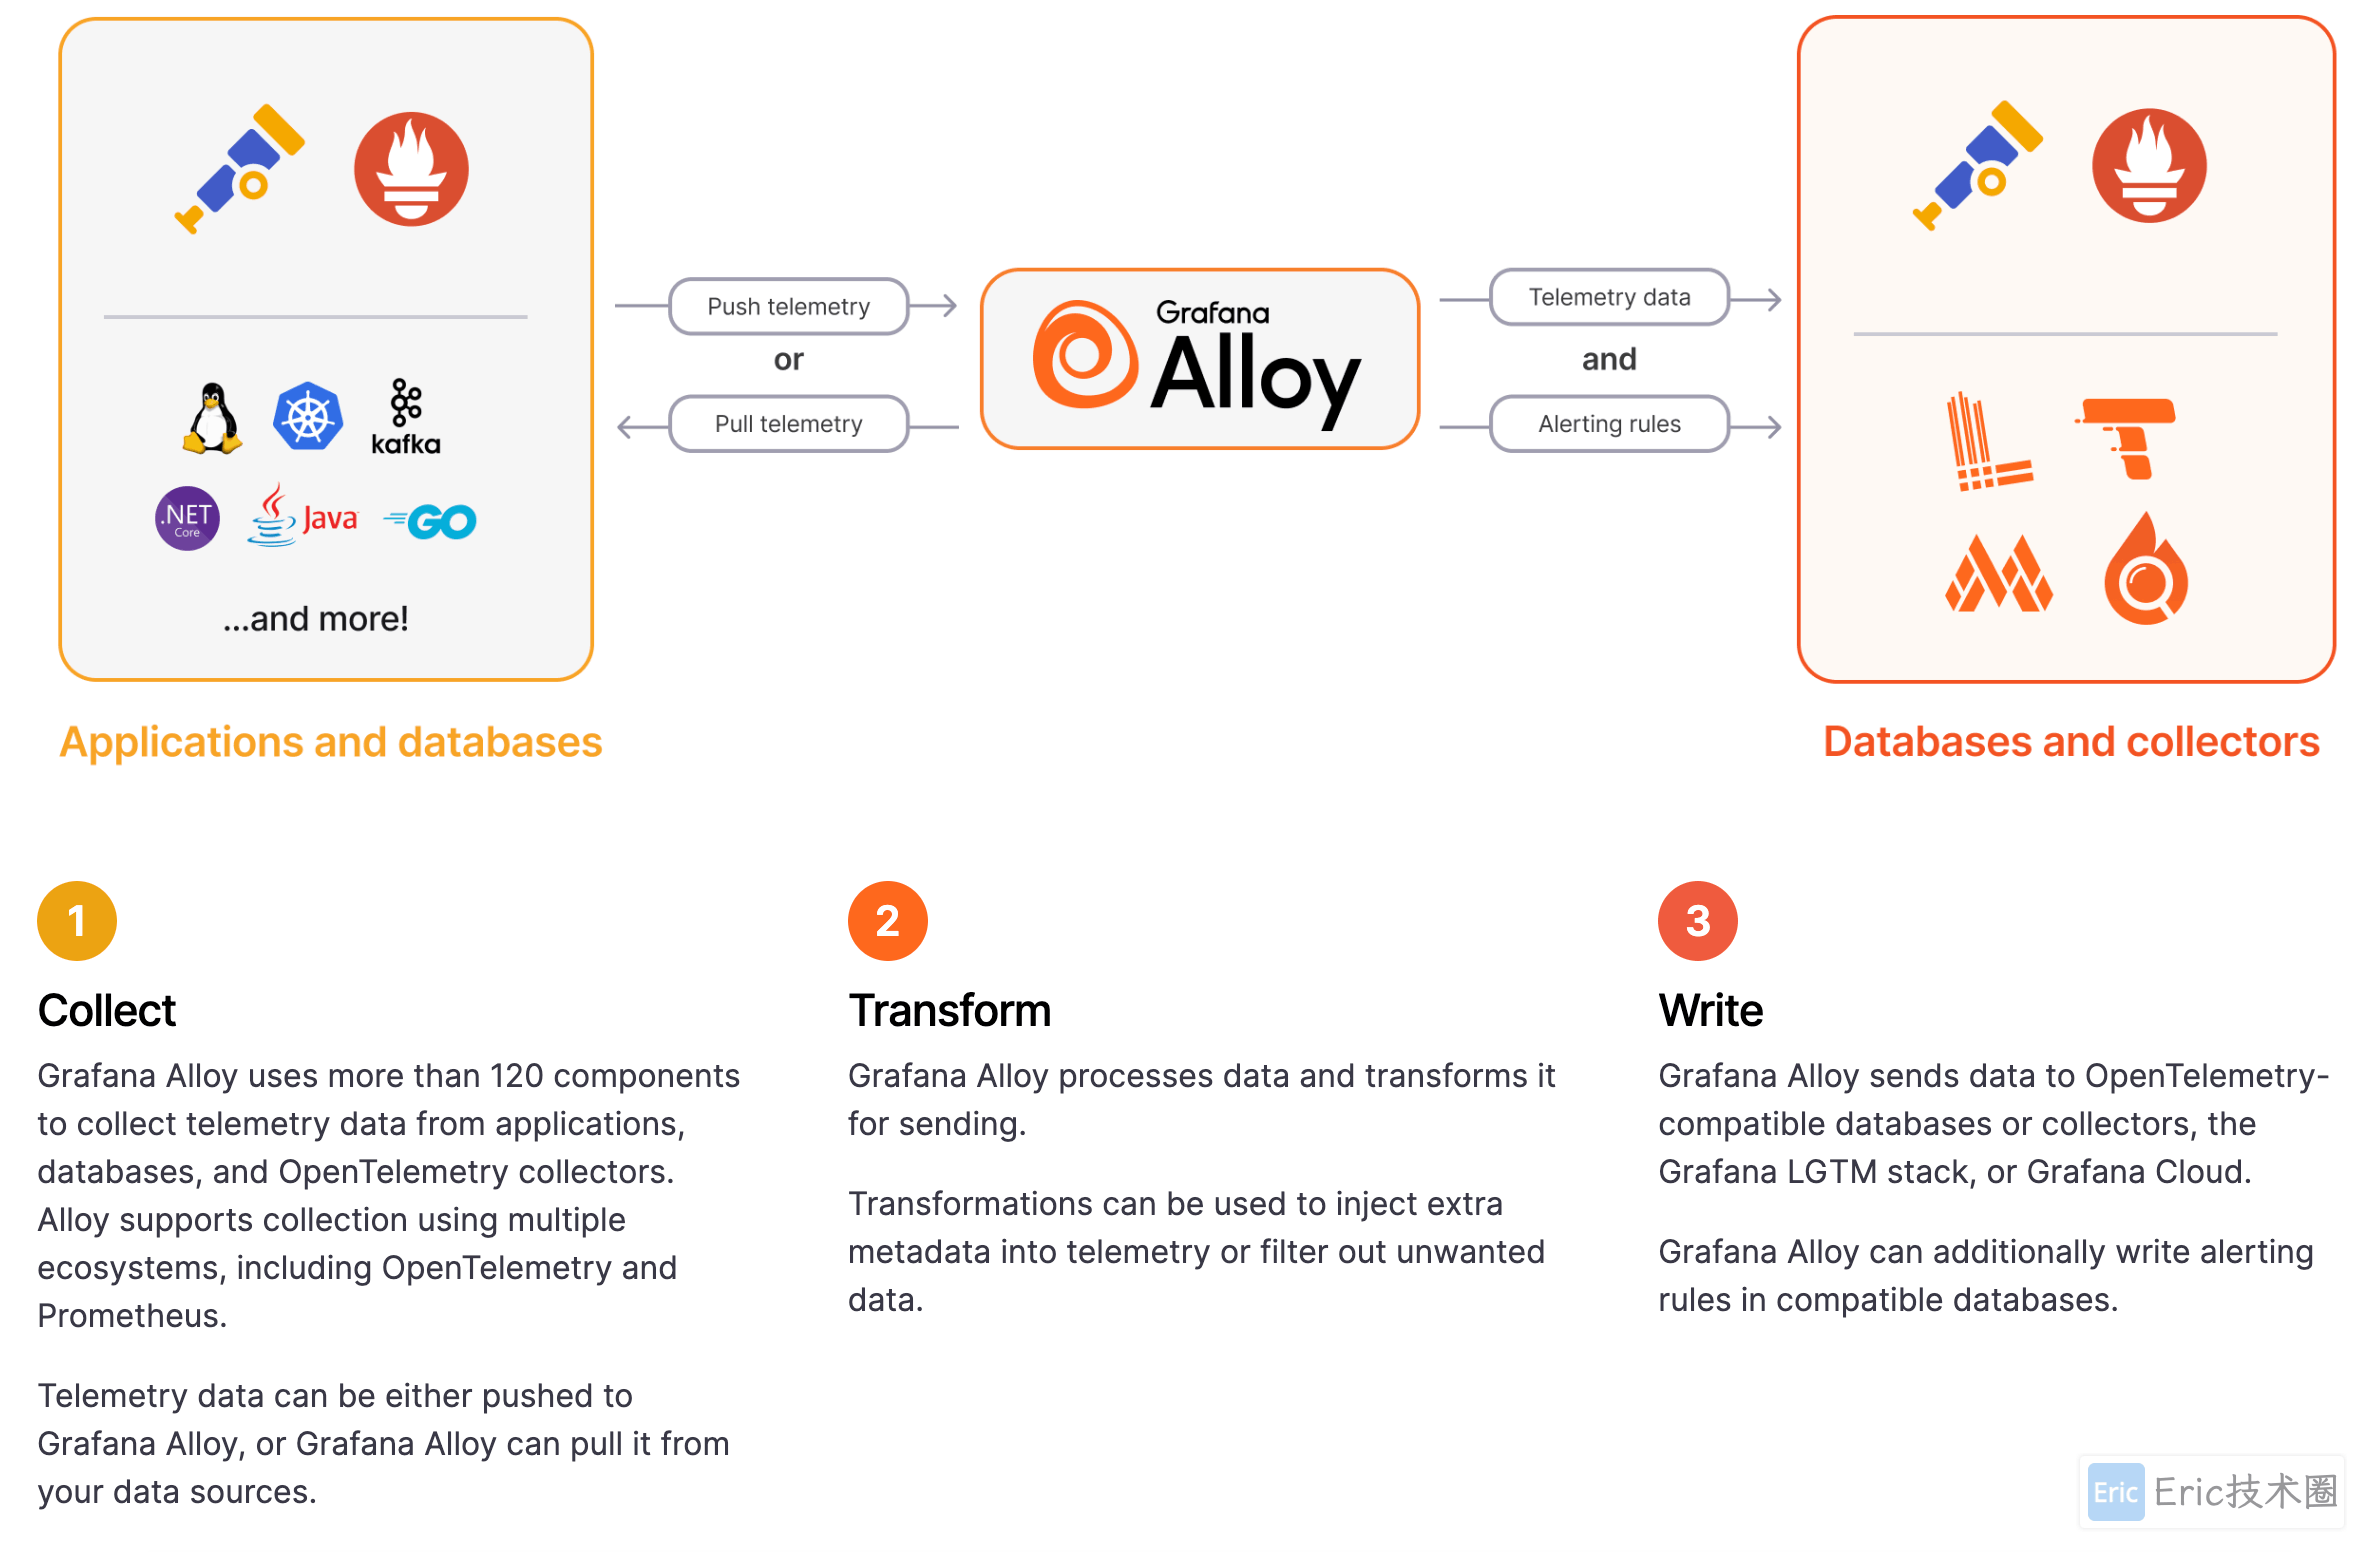
Grafana Alloy 是Grafana Labs对OpenTelemetry Collector的发行版。它是一个与OTLP兼容的收集器,内置Prometheus优化,同时也支持跨指标、日志、跟踪和配置文件发送信号。
Alloy 始于Grafana Labs,并于2024年GrafanaCON上宣布。该项目的使命是创建最佳的“大帐篷”收集器,该收集器与最流行的开源可观察性生态系统兼容,并包括企业级功能,以简化在现代云原生基础设施中的大规模运营。
Alloy 架构图
本地快速验证
这里使用 Docker Compose 进行安装,如下是需要部署的组件图(版本:v3.3.x):
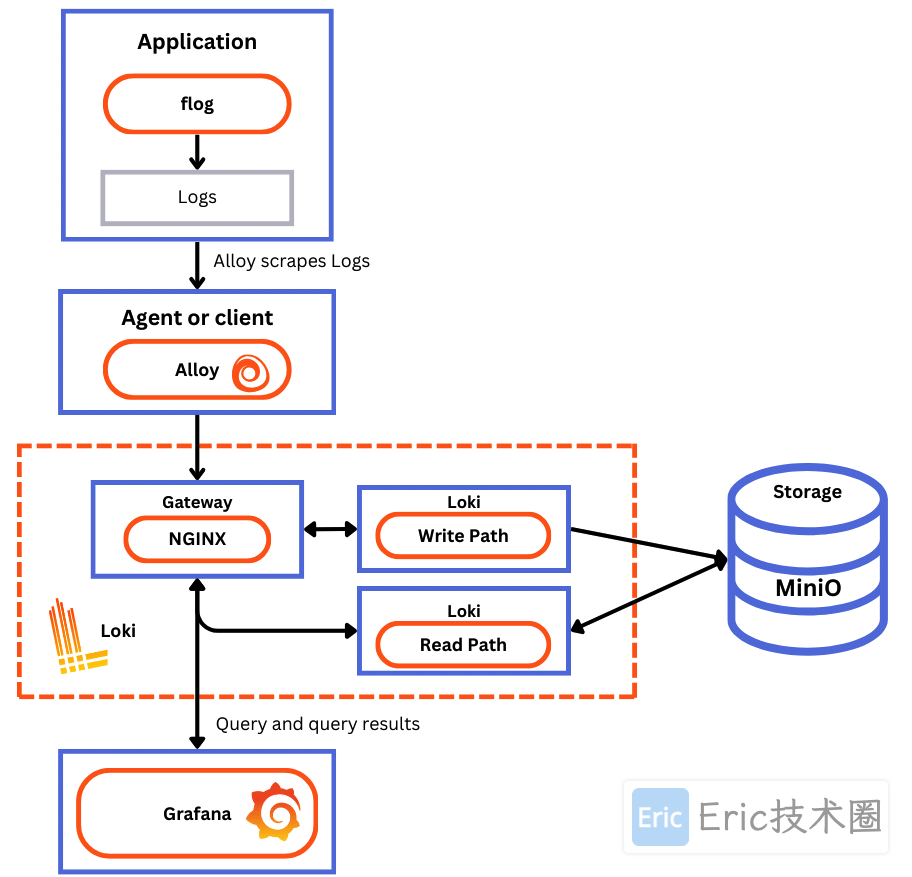
Flog :生成日志行。flog 是用于常见日志格式的日志生成器。
Grafana Alloy :从 flog 抓取日志行并通过网关推送到 Loki。
Gateway (nginx):网关(nginx)接收请求并根据请求的 URL 将它们重定向到相应的容器。
Loki Read 组件 :运行查询前端和查询器。
Loki Write 组件 :运行一个分发器和一个摄取器。
Loki Backend 组件 :运行索引网关、压缩器、规尺、Bloom 规划器(实验性)、Bloom 构建器(实验性)和 Bloom 网关(实验性)。
Minio :Loki 用来存储其索引和块的地方。
Grafana :提供在 Loki 中捕获的日志行的可视化。
接下来下载最新的脚本进行安装和部署。
下载脚本
wget https://raw.githubusercontent.com/grafana/loki/main/examples/getting-started/loki-config.yaml -O loki-config.yaml
wget https://raw.githubusercontent.com/grafana/loki/main/examples/getting-started/alloy-local-config.yaml -O alloy-local-config.yaml
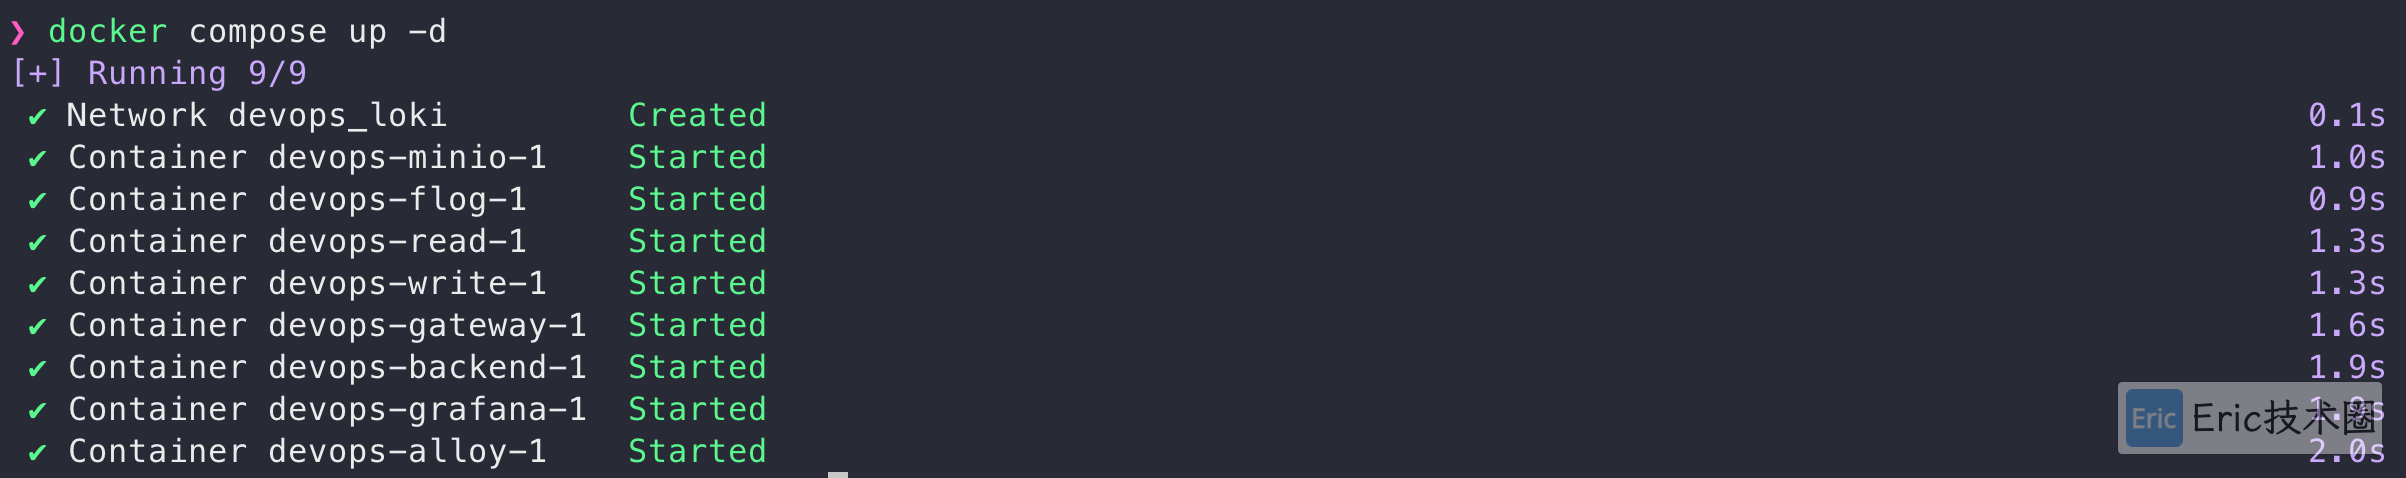
wget https://raw.githubusercontent.com/grafana/loki/main/examples/getting-started/docker-compose.yaml -O docker-compose.yamlDocker 中运行
docker compose up -d运行情况
注意:如果你无法拉取镜像,可以参考我下面的生产部署环节。
验证 Loki 运行情况
验证 read 组件是否 ready,访问: http://localhost:3101/ready,如果没问题的话会输出
ready字符串,否则报错:Query Frontend not ready: not ready: number of schedulers this worker is connected to is 0。验证 write 组件是否 ready,访问:http://localhost:3102/ready,如果没问题的话会输出
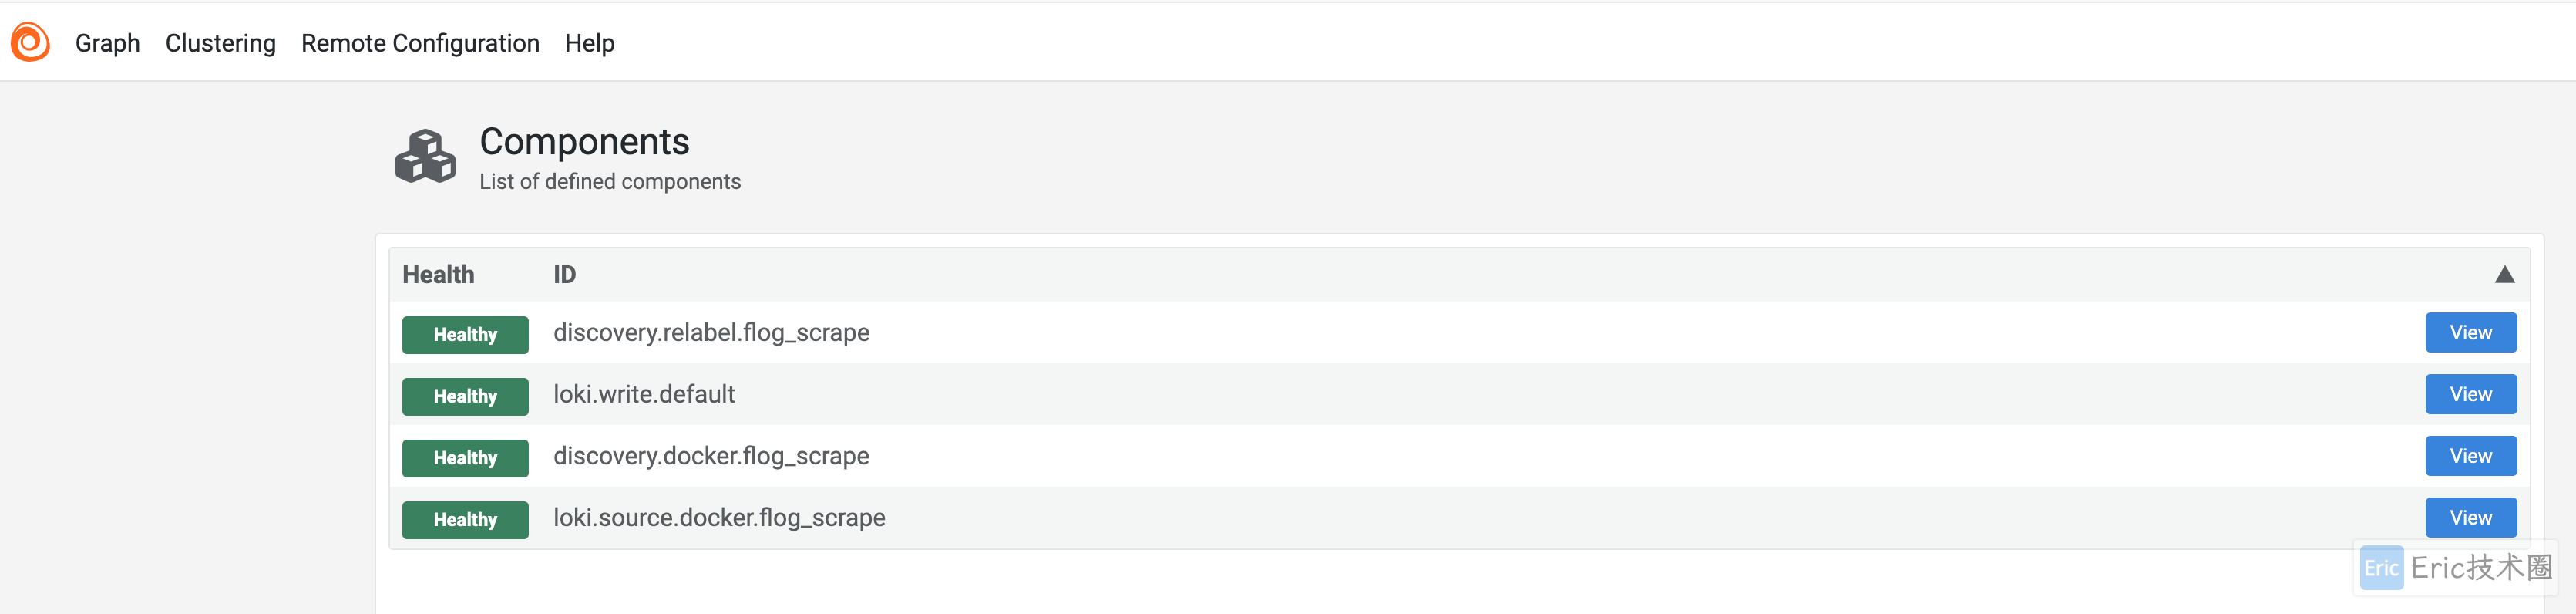
ready字符串,否则报错:Ingester not ready: waiting for 15s after being ready。验证 Grafana Alloy 是否启动,访问:http://localhost:12345,如果显示如下 UI 图片表示正常:
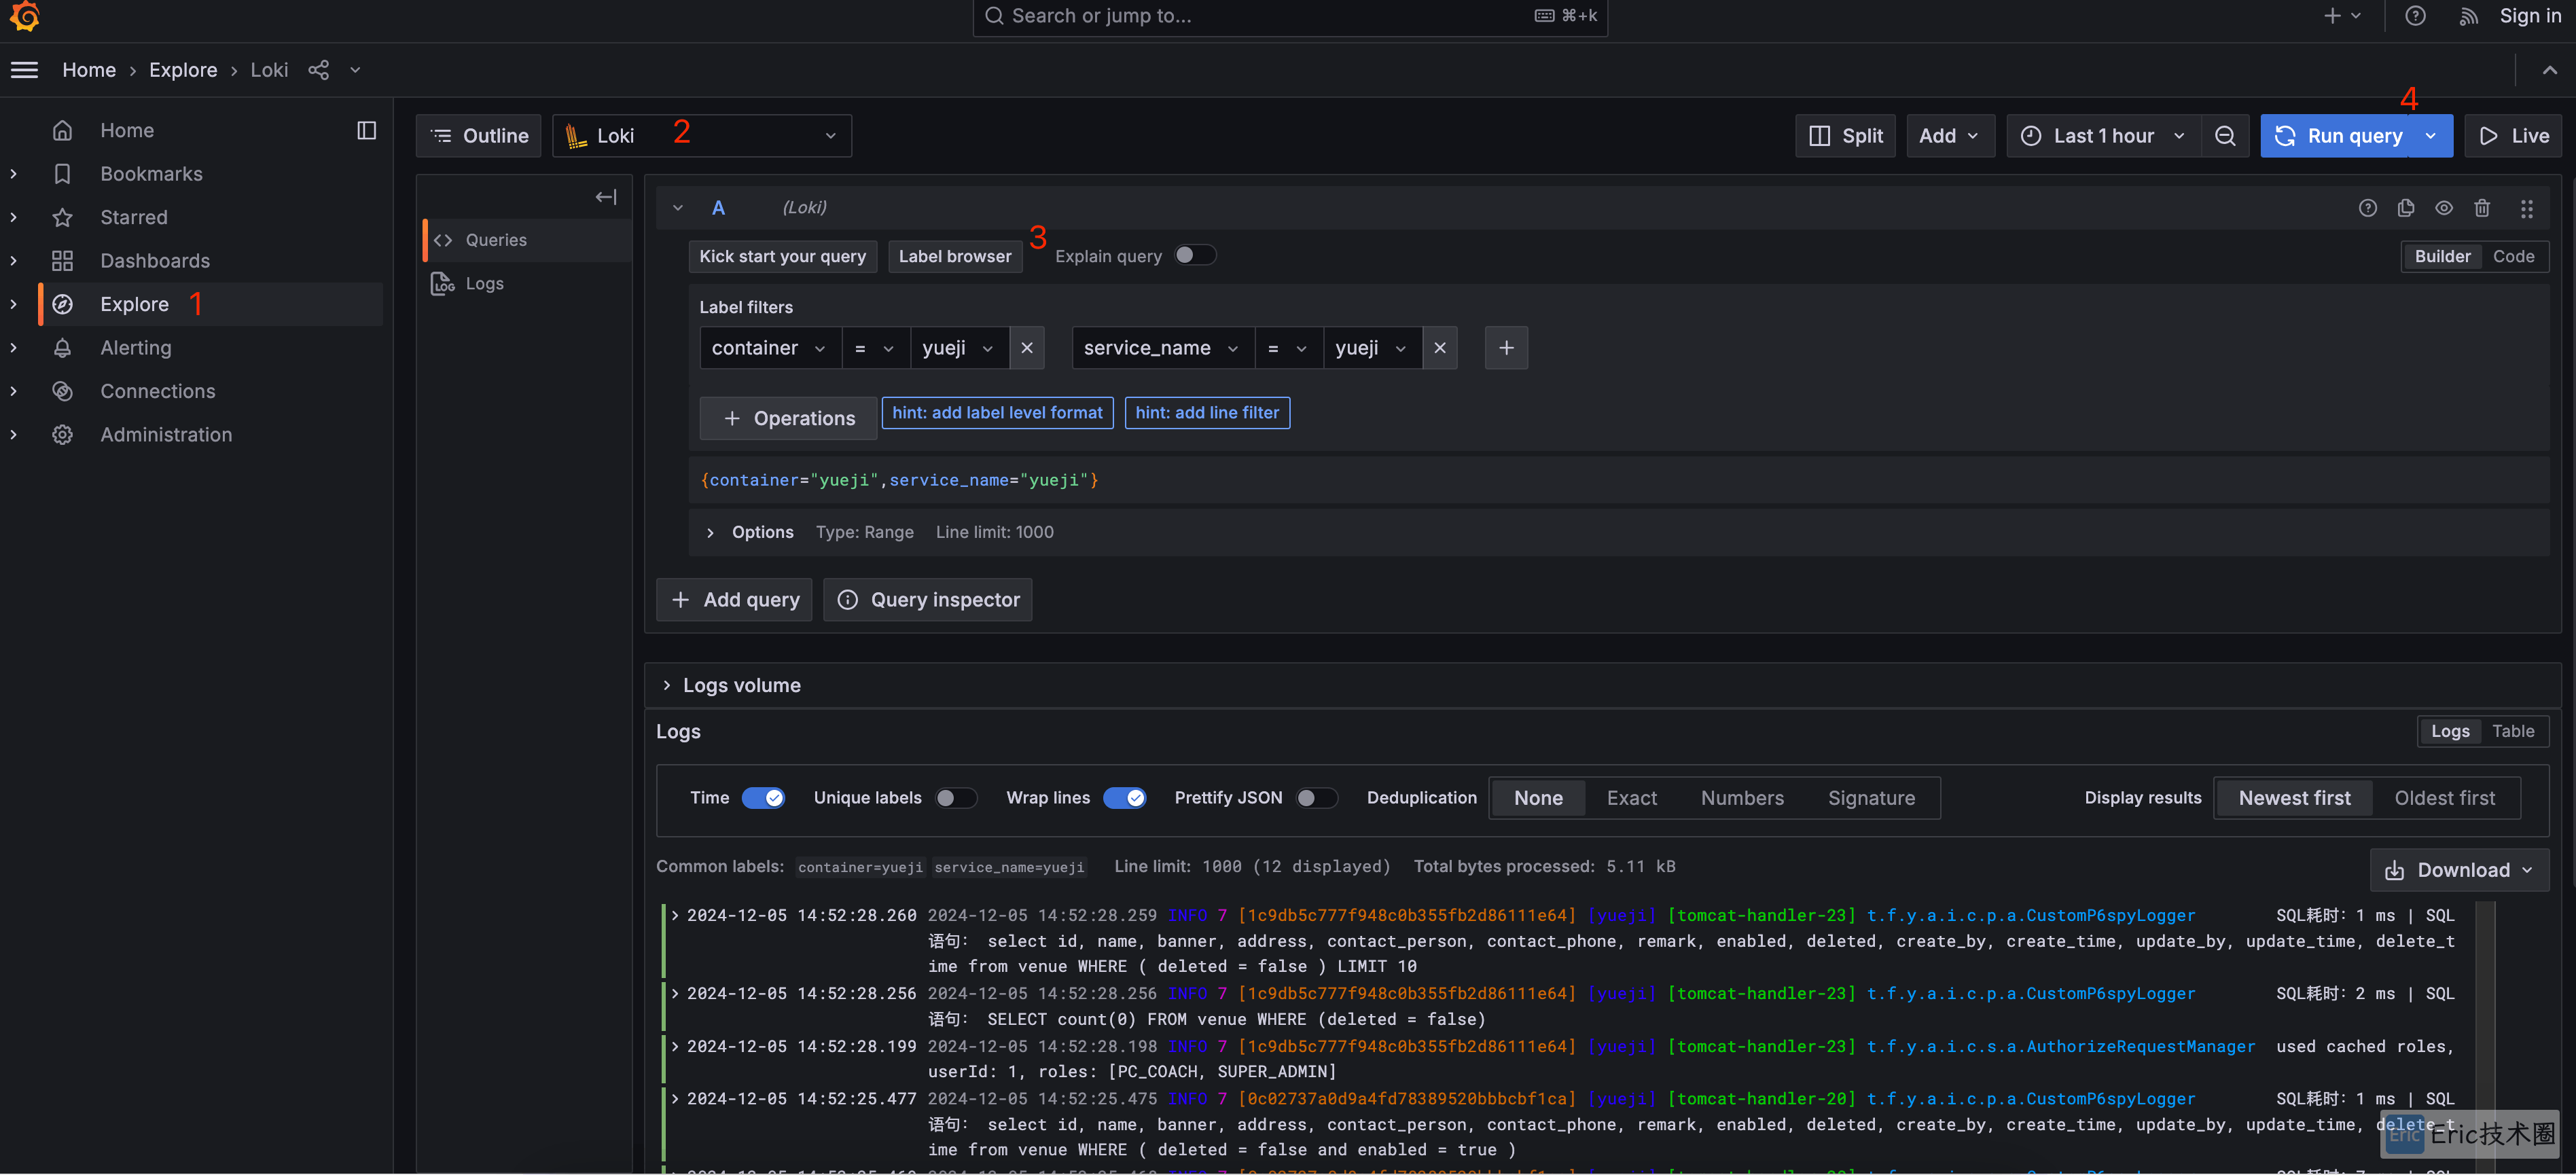
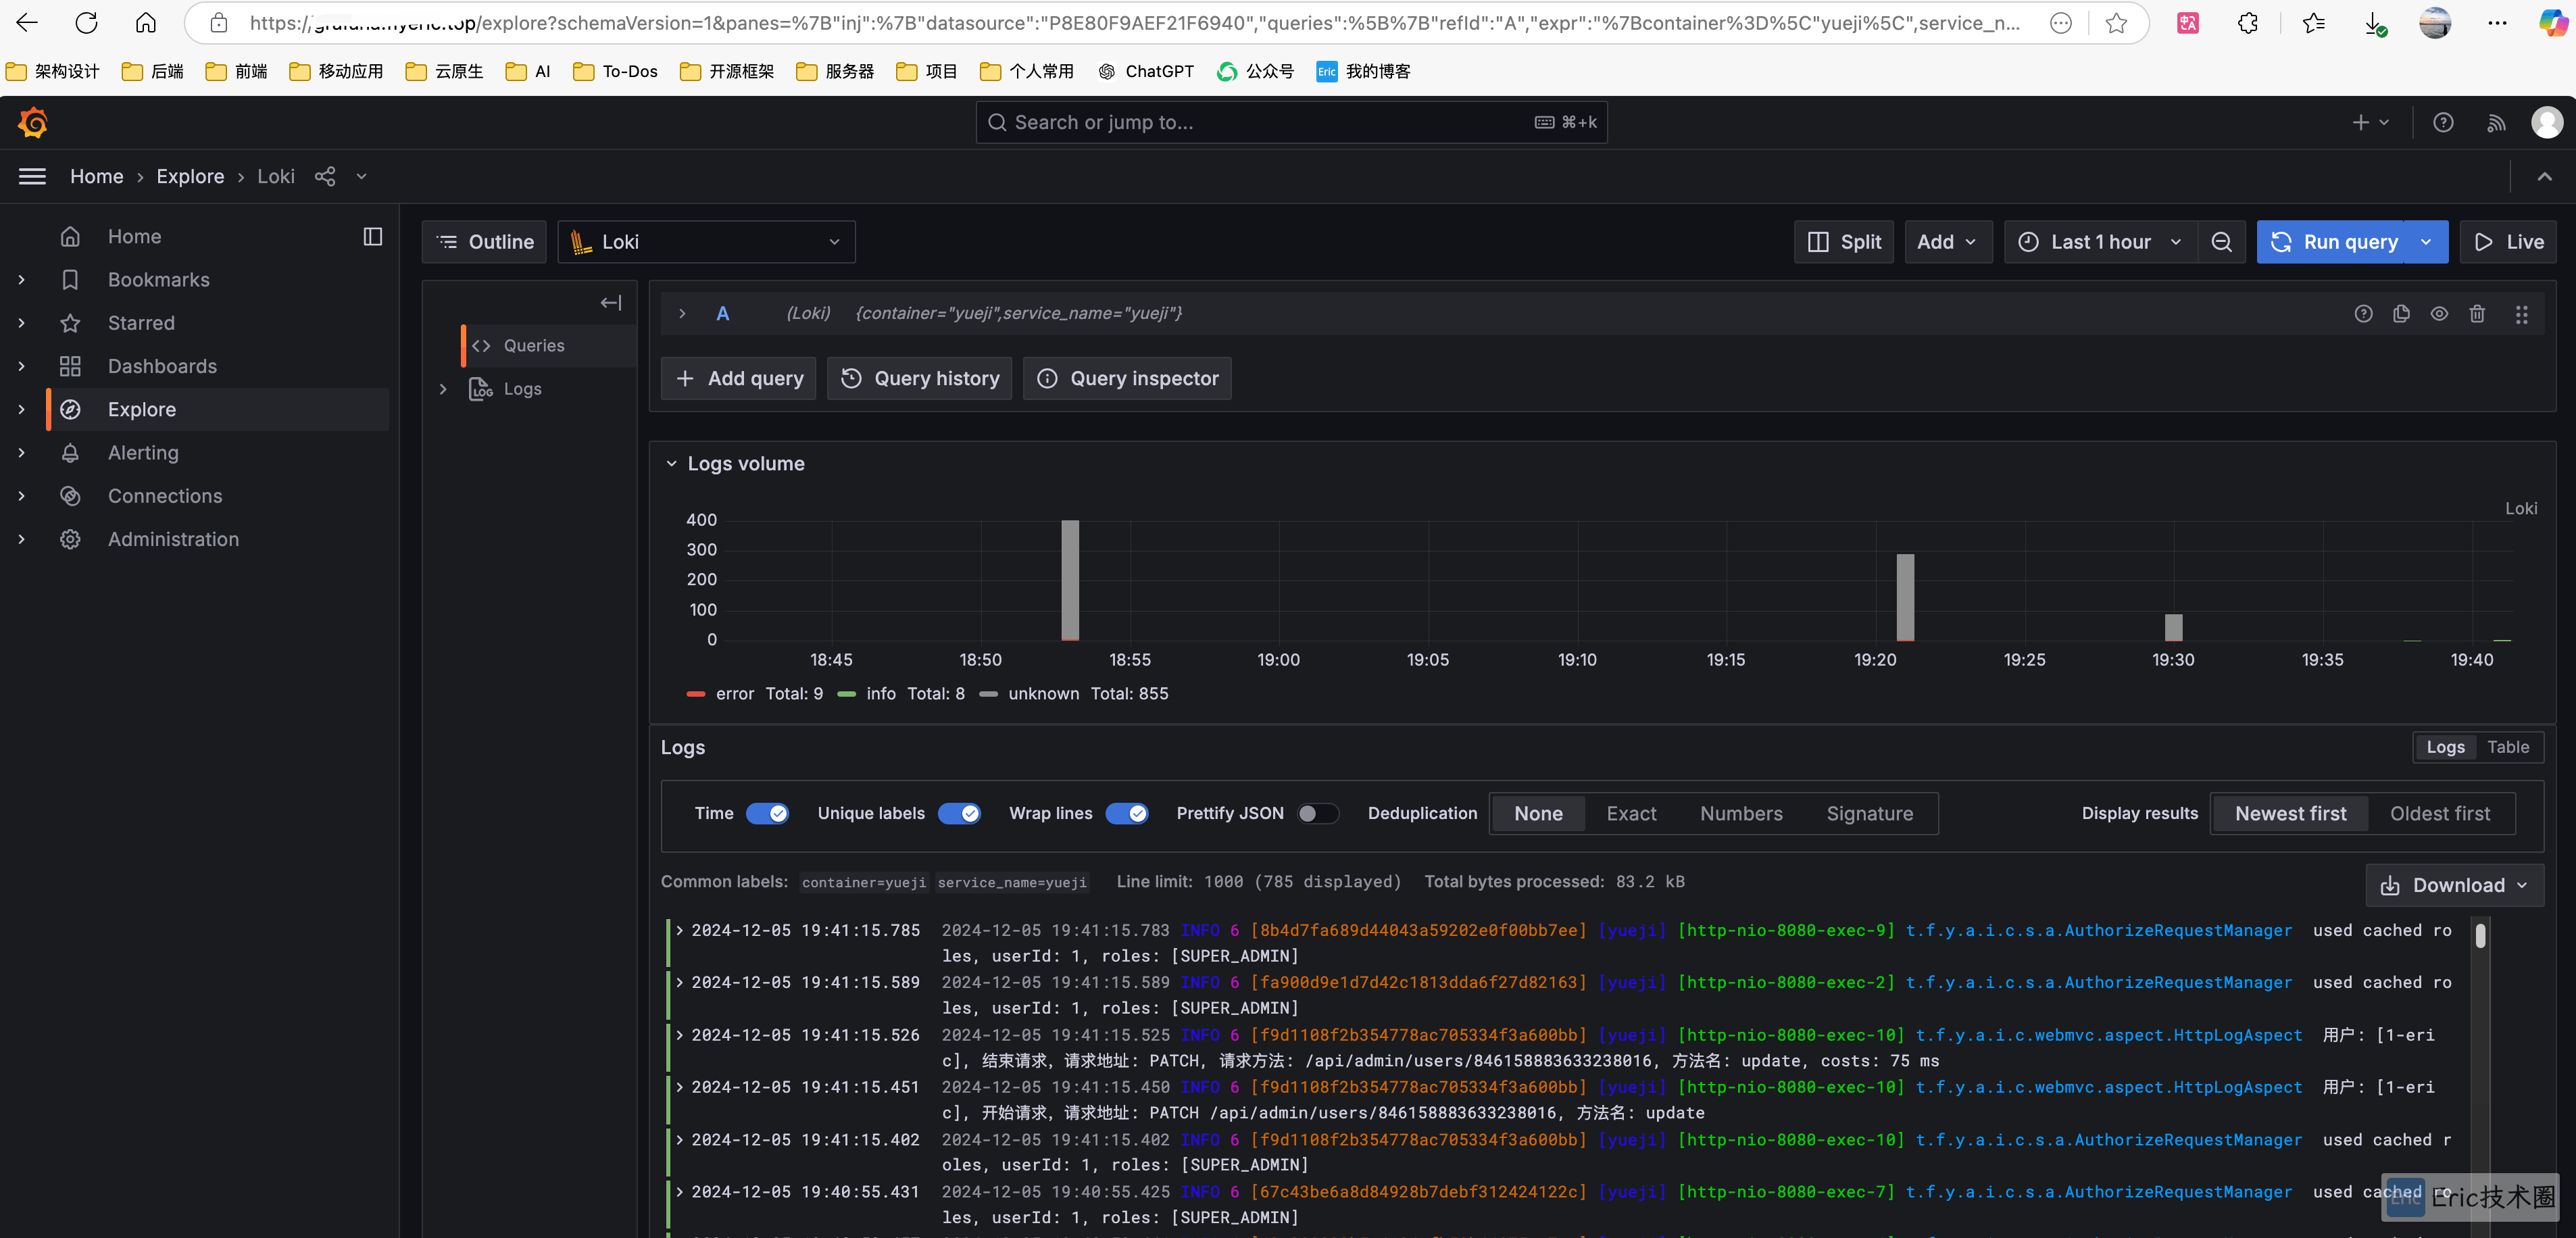
使用 Grafana 查看日志
访问地址:http://localhost:3000。
关闭应用
docker compose down生产部署
01 验证镜像拉取情况
验证下云服务器是否出现无法拉取镜像的问题,需要替换一下docker 镜像源
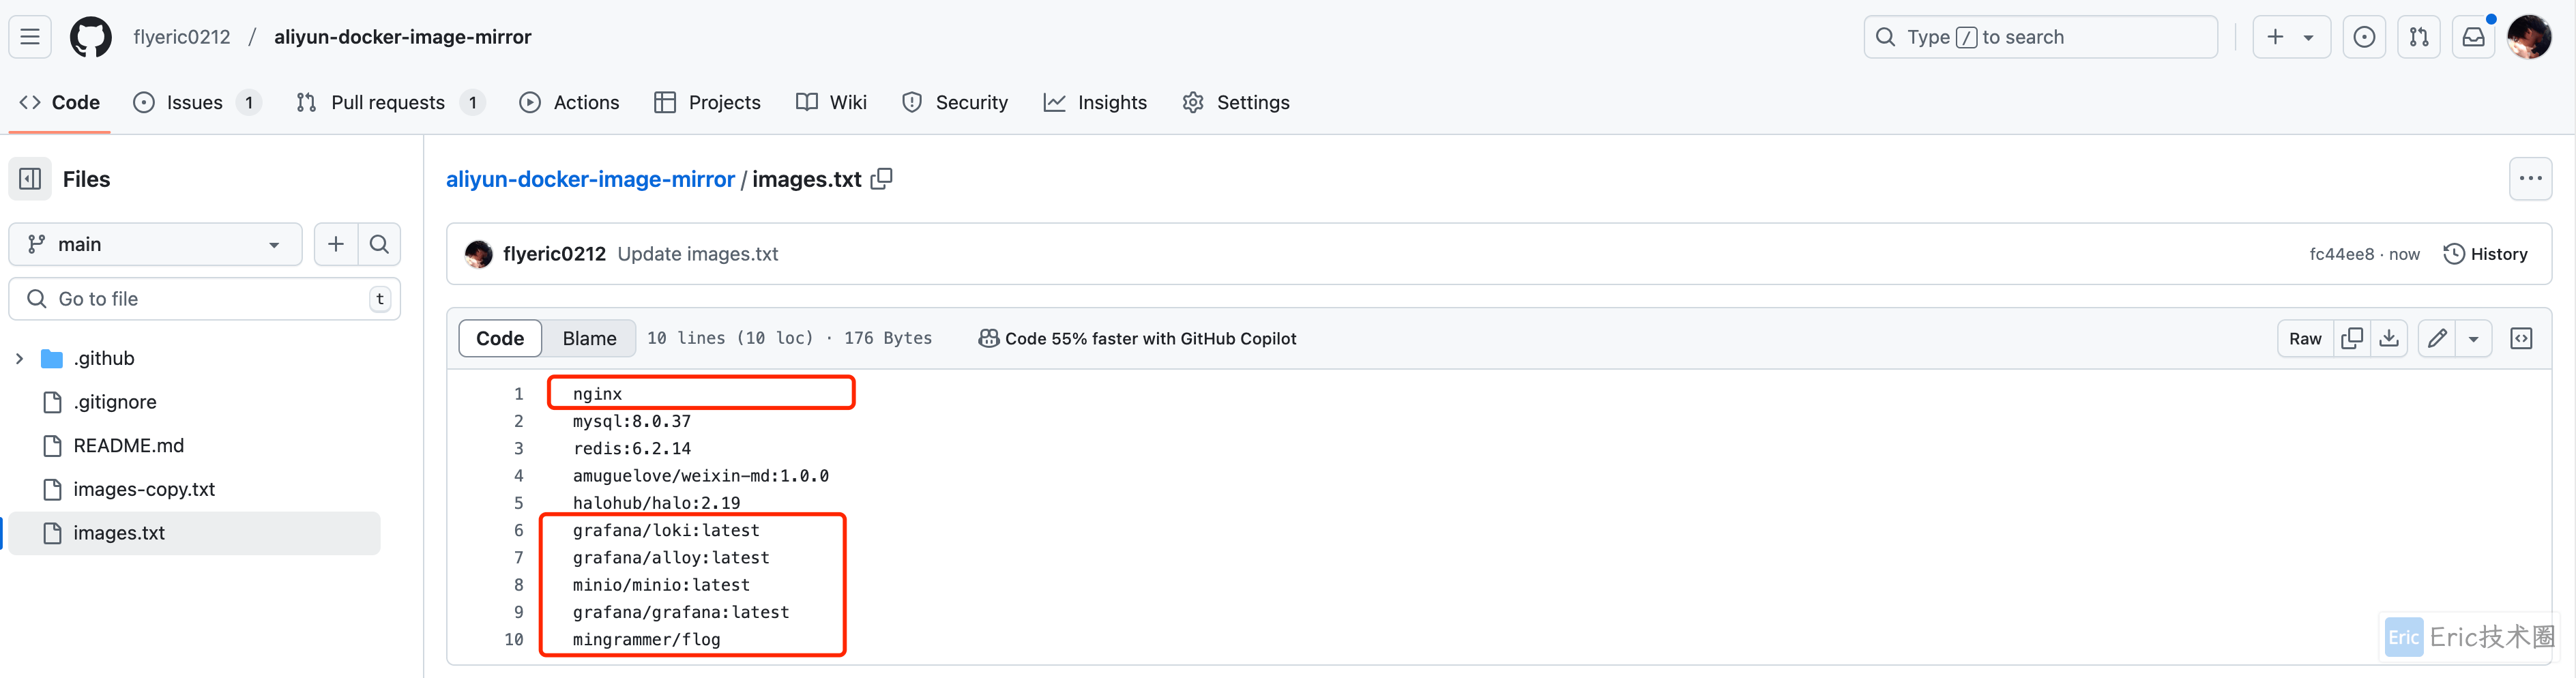
02 使用 Github Actions 替换镜像源
参考我之前的文章:国内无法拉取 Docker 镜像解决方案。
添加需要镜像的 Docker Images,然后等待 Github Actions 执行完成。
03 上传配置到服务器
官方下载的文件中有 Alloy 和 Loki 的配置,需要上传到服务器中。可以新建一个 devops 目录,用于存放配置。这里可以使用 SSH、UI 界面、FTP 等方式,取决于你的云服务器和开放的权限。
04 替换 Docker Compose 中的镜像源
---
networks:
loki:
services:
read:
image: registry.cn-chengdu.aliyuncs.com/flyeric/loki:latest
command: "-config.file=/etc/loki/config.yaml -target=read"
ports:
- 3101:3100
- 7946
- 9095
volumes:
- ./loki-config.yaml:/etc/loki/config.yaml
depends_on:
- minio
healthcheck:
test: [ "CMD-SHELL", "wget --no-verbose --tries=1 --spider http://localhost:3100/ready || exit 1" ]
interval: 10s
timeout: 5s
retries: 5
networks: &loki-dns
loki:
aliases:
- loki
write:
image: registry.cn-chengdu.aliyuncs.com/flyeric/loki:latest
command: "-config.file=/etc/loki/config.yaml -target=write"
ports:
- 3102:3100
- 7946
- 9095
volumes:
- ./loki-config.yaml:/etc/loki/config.yaml
healthcheck:
test: [ "CMD-SHELL", "wget --no-verbose --tries=1 --spider http://localhost:3100/ready || exit 1" ]
interval: 10s
timeout: 5s
retries: 5
depends_on:
- minio
networks:
<<: *loki-dns
alloy:
image: registry.cn-chengdu.aliyuncs.com/flyeric/alloy:latest
volumes:
- ./alloy-local-config.yaml:/etc/alloy/config.alloy:ro
- /var/run/docker.sock:/var/run/docker.sock
command: run --server.http.listen-addr=0.0.0.0:12345 --storage.path=/var/lib/alloy/data /etc/alloy/config.alloy
ports:
- 12345:12345
depends_on:
- gateway
networks:
- loki
minio:
image: registry.cn-chengdu.aliyuncs.com/flyeric/minio
entrypoint:
- sh
- -euc
- |
mkdir -p /data/loki-data && \
mkdir -p /data/loki-ruler && \
minio server /data
environment:
- MINIO_ROOT_USER=loki
- MINIO_ROOT_PASSWORD=supersecret
- MINIO_PROMETHEUS_AUTH_TYPE=public
- MINIO_UPDATE=off
ports:
- 9000
volumes:
- ./.data/minio:/data
healthcheck:
test: [ "CMD", "curl", "-f", "http://localhost:9000/minio/health/live" ]
interval: 15s
timeout: 20s
retries: 5
networks:
- loki
grafana:
image: registry.cn-chengdu.aliyuncs.com/flyeric/grafana:latest
environment:
- GF_PATHS_PROVISIONING=/etc/grafana/provisioning
- GF_AUTH_ANONYMOUS_ENABLED=true
- GF_AUTH_ANONYMOUS_ORG_ROLE=Admin
depends_on:
- gateway
entrypoint:
- sh
- -euc
- |
mkdir -p /etc/grafana/provisioning/datasources
cat <<EOF > /etc/grafana/provisioning/datasources/ds.yaml
apiVersion: 1
datasources:
- name: Loki
type: loki
access: proxy
url: http://gateway:3100
jsonData:
httpHeaderName1: "X-Scope-OrgID"
secureJsonData:
httpHeaderValue1: "tenant1"
EOF
/run.sh
ports:
- "3000:3000"
healthcheck:
test: [ "CMD-SHELL", "wget --no-verbose --tries=1 --spider http://localhost:3000/api/health || exit 1" ]
interval: 10s
timeout: 5s
retries: 5
networks:
- loki
backend:
image: registry.cn-chengdu.aliyuncs.com/flyeric/loki:latest
volumes:
- ./loki-config.yaml:/etc/loki/config.yaml
ports:
- "3100"
- "7946"
command: "-config.file=/etc/loki/config.yaml -target=backend -legacy-read-mode=false"
depends_on:
- gateway
networks:
- loki
gateway:
image: registry.cn-chengdu.aliyuncs.com/flyeric/nginx:latest
depends_on:
- read
- write
entrypoint:
- sh
- -euc
- |
cat <<EOF > /etc/nginx/nginx.conf
user nginx;
worker_processes 5; ## Default: 1
events {
worker_connections 1000;
}
http {
resolver 127.0.0.11;
server {
listen 3100;
location = / {
return 200 'OK';
auth_basic off;
}
location = /api/prom/push {
proxy_pass http://write:3100\$$request_uri;
}
location = /api/prom/tail {
proxy_pass http://read:3100\$$request_uri;
proxy_set_header Upgrade \$$http_upgrade;
proxy_set_header Connection "upgrade";
}
location ~ /api/prom/.* {
proxy_pass http://read:3100\$$request_uri;
}
location = /loki/api/v1/push {
proxy_pass http://write:3100\$$request_uri;
}
location = /loki/api/v1/tail {
proxy_pass http://read:3100\$$request_uri;
proxy_set_header Upgrade \$$http_upgrade;
proxy_set_header Connection "upgrade";
}
location ~ /loki/api/.* {
proxy_pass http://read:3100\$$request_uri;
}
}
}
EOF
/docker-entrypoint.sh nginx -g "daemon off;"
ports:
- "3100:3100"
healthcheck:
test: ["CMD", "service", "nginx", "status"]
interval: 10s
timeout: 5s
retries: 5
networks:
- loki
flog:
image: registry.cn-chengdu.aliyuncs.com/flyeric/flog
command: -f json -d 500ms -l
networks:
- loki
05 配置域名
将 Grafana 3000 端口进行域名映射方便外网访问。
小结
三百多 MB 的内存就可以运行,还是推荐试一试的。
以上是通过 Docker Compose 的方式快速部署和验证,如果想要进行生产级别使用,可以考虑使用 Kubernetes 云原生,参考官方最新文档大致需要如下组件:
Loki:默认开启
Promtail:默认开启
Fluent Bit:默认关闭
Grafana:默认关闭
Prometheus:默认关闭
Filebeat:默认关闭
LogStash:默认关闭
需要根据具体的情况,选择日志收集的工具。
参考
欢迎关注我的公众号“Eric技术圈”,原创技术文章第一时间推送。